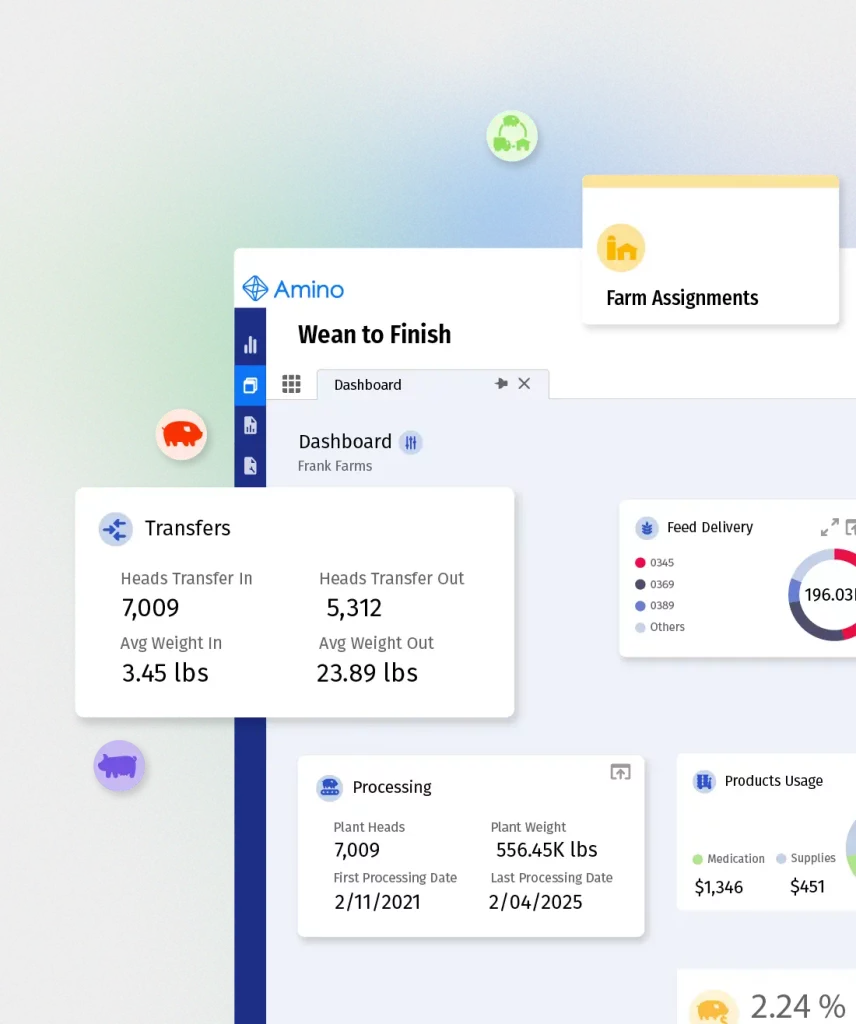
Business intelligence and data analytics tools for producers
The industry’s only comprehensive dashboard solution ready out-of-the-box
Axis helps producers uncover potential risks as well as revenue and cost-saving opportunities by revealing the biggest influences behind every outcome. Focus your efforts on what matters most.
Industry specific dashboards, analytics and reports across the supply-chain
Breeders
Analyze visual report dimensions such as breed, geography, nutrition, and management.
Hatchery
Examine reports focusing on egg movements from receiving, through incubation, and all the way to hatching of day olds.
Growout
Gain insight through dashboard reports focused on growing the animals and delivering a perfect product to processing.
Feed Mill
Optimize nutrition using reports focused on ingredients and finished feed, ensuring efficient use of raw materials and tracking performance into the barns.
“90 percent of the digital data ever created in the world has been generated in just the past two years, only 1 percent of that data has been analyzed”

Why use business intelligence
The problem
Data collection is rapidly increasing, and many companies do not have the resources to handle it.
The Strategy
Utilize the power of AI to sift through the data, to pullout the necessary insights, to tell you the right story helping you make smarter decisions.
The Solution
Leverage the development of a fully featured analytics package specific to your business from the global leader in poultry solutions.
Discover patterns and meaning in your data with Axis
Access to quality data anytime, anywhere
Save time by eliminating the data transformation process
Analyze big volumes of data quickly
Transform data into insight faster
“Some of our partners have told me that what I showed them in 30-minutes would take them 7-hours or more to put together.
Business Analytics Director, MTech Systems
Features that bring data to life for business value
Built on 30 years of developing poultry analysis, Axis provides industry-designed dashboards and reports to bring your data to life.
- Compare actual vs. budget analysis
- Drill down to see key data using power pivot tables
- Compare data points by region, arm, machine, and more
- Easily identify anomalies that could turn into significant business issues
- See multiple years of data presented visually in one versatile chart
- Identify trend variations by week, month or year, from high-level to granular insights
Why wait to get a more realistic perception of your business?
Access our cloud-based solution or install on-site.
Leverage the organic integration of Axis to your current MTech Systems management platform.
Reach out with Axis to external data sets that may enhance your production analysis.
Expand on our out-of-the-box report portfolio with user defined dashboards.